Showing posts with label Pricing. Show all posts

Saturday, March 5, 2011

New Asia Region & SpotWatch Update

Amazon released a new (5th) regions for AWS a couple of days ago, this was announced by Jeff Barr on the Amazon Web Services Blog like this:
We've just opened up an AWS Region in Japan, Tokyo to be precise. The new region supports Amazon EC2 (including Elastic IP Addresses, Amazon CloudWatch, Elastic Block Storage, Elastic Load Balancing, VM Import, and Auto Scaling), Amazon S3, Amazon SimpleDB, the Amazon Relational Database Service, the Amazon Simple Queue Service, the Amazon Simple Notification Service, Amazon Route 53, and Amazon CloudFront. All of the usual EC2 instance types are available with the exception of the Cluster Compute and Cluster GPU. The page for each service includes full pricing information for the Region.

I looked into this new region and made conclusions, some of them are listed below. The Excel file containing all of the tables and graphs can be found here. I delayed the pricing analysis that includes spot instances, since there is only data available from the first 4 days since the launch of this new Tokyo region. I added however support for this new region to my SpotWatch tool website, so we'll be able to follow the price evolution easily. I also made some little changes, check it out at the SpotWatch website. Thanks for the feedback I got about this little tool, it's fun to see people are interested in my work.

  • It's the first time that the fixed upfront investment for a reserved instance is different for a region, all other regions hold the same fixed prices. These in Tokyo are a bit higher.


  • The on-demand prices for linux instances are the most expensive in the Tokyo region, US-East is still the cheapest region, all others hold the same hourly price values that lay between the ones of these two regions.


  • Reserved instances are more expensive in the new Notheast Asia region relative to on-demand prices than in the other regions (except for the Micro instance).


  • Data transfer costs are the same in the US and EU regions, they are a bit higher in Southeast Asia and even more expensive in the new Tokyo region.
I started writing again too, I hope to finish a draft version of the 2nd/3rd chapter of my thesis soon.

Sunday, December 5, 2010

EC2 On-Demand/Reserved Pricing History

Amazon EC2 instance prices are not fixed, in a way that Amazon has the ability to change these prices at any given moment in time. It should not come as a surprise that prices have decreased over the last couple of years. This is a rather natural phenomenon ... since the instances that existed back then do still have the same specifications, but their hardware cost have decreased dramatically. So, Amazon is able to keep being competitive by lowering its prices. When making a division between the different instance types, this possibility should be taken into account. If one should pay the reserved instance rate for the rest of the period the instance was rented, the price change that is predicted could be taken into account as a discount on the on-demand prices. To be able to make such conclusions one should have a look at the price decreases that happened in the past, so I'll give a little history overview of the EC2 instances and their pricing.

The history of EC2 and its instances is given in a chronological order, when prices did change they will be presented as well:
  • [24/08/2006] Amazon Elastic Compute Cloud beta is announced. There was only one instance type (1.7GHz Xeon processor/1.74 GB of RAM) available for $0.10 per hour.

  • [22/10/2007] EC2 in unlimited beta and new instance types are announced.

  • [29/05/2008] High-CPU instances announced.

  • [23/10/2008] EC2 exits beta and offers SLA with commitment of 99.95% availability within a region.
  • [23/10/2008] EC2 instances running Windows Server available.

  • [10/12/2008] the European Region is added.
  • [08/01/2009] the AWS management console is launched.
  • [03/03/2009] Windows instances announced for the EU region.
  • [12/03/2009] EC2 introduces Reserved instances

  • [15/04/2009] Reserved instances now available in Europe.
  • [20/08/2009] prices of Reserved instances are decreased.

  • [30/09/2009] distinction between instances running Windows and instances running Windows with Authentication Services is removed (the price of the general Windows instances is put in place).
  • [27/10/2009] new High-Memory instances announced.

  • [27/10/2009] all other on-demand prices are lowered with up to 15%
  • [03/12/2009] Northern California region launched.
  • [14/12/2009] Amazon EC2 Spot instances announced.
  • [23/02/2010] Extra Large High Memory instances get introduced.

  • [23/02/2010] EC2 instances with Windows now available.

  • [29/04/2010] Asia Pacific (Singapore) Region announced
  • [13/07/2010] Cluster Compute instances announced.

  • [01/09/2010] Lower prices for High Memory Double and Quadruple XL instances.

  • [09/09/2010] Micro instances are announced.

  • [21/10/2010] AWS Free Usage Tier introduced.
  • [15/11/2010] Cluster GPU instances announced.

  • [03/12/2010] Free monitoring of CPU, disk and network performance metrics through CloudWatch is introduced.
Your hourly rate for reserved instances is changed as well when prices are changed, which can be seen in the official press release of the price reduction that happened in september.
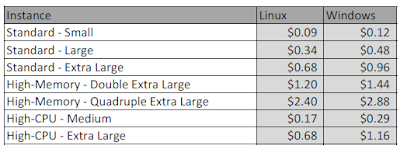
Effective September 1, 2010, we've reduced the On-Demand and Reserved Instance prices on the m2.2xlarge (High-Memory Double Extra Large) and the m2.4xlarge (High-Memory Quadruple Extra Large) by up to 19% and the Reserved Instances by up to 17%. If you have existing Reserved Instances your hourly usage rate will automatically be lowered to the new usage rate and your estimated bill will reflect these changes later this month.
You however still paid the full one-time fee, so these possible changes could still be taken into account. We notice however that not that many price reductions have happened in the EC2 history. Most of the new prices were made when a new instance type was introduced. The only real general price reduction happened in October 2009, when all on-demand prices were lowered up to 15%. But prices will probably have to change more often in the future since market pressure will rise.

Tuesday, November 2, 2010

Amazon EC2 News Links

The Amazon Web Services are always evolving, with new instance types being introduced in EC2, pricing models being changed, ... The last couple of weeks some announcements were made:
  • A Free Usage Tier for AWS is introduced: which means that since 1 November 2010 new customers get a certain amount of free services e.g. 750 hours of Micro Linux instances on EC2. More information can be found on the official website.
  • The Amazon S3 prices got an update: in general they decreased and a 1TB tier was added and the 50-100TB tier was removed. The new prices can be consulted on the official website. To conclude this little news post I quote TechCrunch: "Amazon is continuing to drive down the developer costs for storing existing data, emphasizing the advantages of using cloud computing versus a fixed hard drive for storage."
An updated version of my Excel worksheet can be downloaded here.

Monday, November 1, 2010

Comparison Instance Pricing in Regions

I updated the excel worksheet I created to analyse the price differences of the EC2 instances across the different regions. An updated version can be downloaded here, in this spreadsheet some corrections are made and all previous done Excel research is combined in this one file.

I also created a normalised version of the instance price comparison, for the US East region this resulted in this graph:

For the EU region we got the following graph:

What can be concluded from these graphs is:
  • The Cluster Compute Instance is not available in the EU Region. (CloudExchange.org does not provide spot price history for Micro Instances either)
  • In the US East the reserved prices (when assumed that they are bought for a year) are about 65 percent of the on demand prices, while in the EU region this is about 70 percent.
  • Spot prices lay just below 40 percent of on demand prices in the US East region, in the EU region this is just above 40 percent.
  • There is one remarkable price: Standard Large Spot Instances are relatively more expensive in the US East region.

Sunday, October 31, 2010

Statistical Analysis EC2 Spot Pricing Evolution

First of all I'm sorry for the lack of updates the last week (my sickness had something to do with it). But now I'm fully focusing on my thesis again.

The different scenarios of dividing the spot prices I'm having a look at are:
  • Average per day for the last 2 months
  • Average per week
  • Average per day of the week
  • Average per hour of the day
  • Average for the day vs the night
After generating the required graphs (also blox pots cfr what is it) for these scenarios (all output by the way can be downloaded here), I started having a look at how this data (or statistics extracted from this data) could be used to perform intelligent capacity planning.

The statistical values I store for every scenario (and this for each os-region-instance type combination possible) are:
  • Kurtosis: "it is a measure of the 'peakedness' of the probability distribution of a real-valued random variable. Higher kurtosis means more of the variance is the result of infrequent extreme deviations, as opposed to frequent modestly sized deviations."
  • Skewness: "it is a measure of the asymmetry of the probability distribution of a real-valued random variable. The skewness value can be positive or negative, or even undefined. Qualitatively, a negative skew indicates that the tail on the left side of the probability density function is longer than the right side and the bulk of the values (including the median) lie to the right of the mean. A positive skew indicates that the tail on the right side is longer than the left side and the bulk of the values lie to the left of the mean. A zero value indicates that the values are relatively evenly distributed on both sides of the mean, typically but not necessarily implying a symmetric distribution."
  • Arithmetic mean: "it is often referred to as simply the mean or average when the context is clear, is a method to derive the central tendency of a sample space."
  • Geometric mean: "it indicates the central tendency or typical value of a set of numbers. It is similar to the arithmetic mean, which is what most people think of with the word "average", except that the numbers are multiplied and then the nth root (where n is the count of numbers in the set) of the resulting product is taken."
  • Number of Values: "it is an indication of the number of price changes."
  • Maximum: "it is the greatest value in the set."
  • Minimum: "it is the smallest value in the set."
  • Percentile: "it is the value of a variable below which a certain percent of observations fall. The 25th percentile is also known as the first quartile (Q1); the 50th percentile as the median or second quartile (Q2); the 75th percentile as the third quartile (Q3)."
  • Variance: "it is used as one of several descriptors of a distribution. It describes how far values lie from the mean."
  • Standard deviation: "it is a widely used measurement of variability or diversity used in statistics and probability theory. It shows how much variation or 'dispersion' there is from the 'average' (mean, or expected/budgeted value). A low standard deviation indicates that the data points tend to be very close to the mean, whereas high standard deviation indicates that the data is spread out over a large range of values."
I'll explain all my findings in the document I'm working on that summarizes the research I've done and tells how I think to extract information from it that can be helpful to make an intelligent capacity planner. The project that I used to generate the graphs and statistical ouput is called 'SpotPricing' and can be found on my SVN location or here.

Saturday, October 16, 2010

Amazon Spot Instance Pricing [CloudExchange.org]

After getting some advice, I made some new graphs from the cloudexchange input data that:
  • plots the average spot price for each day of the week (for every instance type)
  • plots the average spot price during each hour of the day (for every instance type)
A first example of this new output for a us-east-1.linux.c1.xlarge spot instance:


And as a second example the output for a us-east-1.linux.m1.xlarge spot instance:


We notice that some spot instances have a rather fluctuating price during the day and over the days of the week, while others do not show this behavior. This updated version of the software can be found here. And all the generated graphs can be downloaded from this location.

Afterwards I made a little program that takes the CSV files found on cloudexchange.org as input and calculates what the average spot instance price has been between two given dates for each instance type. This program can be downloaded here. The output is written to a new CSV file, for the Linux instances a PDF version of this file can be found here.

Sunday, October 10, 2010

Amazon Spot Instances Pricing [CloudExchange.org]

On cloudexchange.org we find the history of the price of the different Amazon Spot instances, this data is exporteable as an CVS file.
I made a little Java program (download here) that takes this file as input and generates the following graphs:
  • one containing the average price for the spot instance during each day

  • one with a line representing the average price during the day and a line for the average price during the night (0:00-8:00AM)
On the following graph we notice that for the corresponding spot instance (us-east-1.linux.m2.4xlarge) the average day price does not have peaks during the weekends (2 units on the rights of every vertical grid line), which seems logical.


For the same instance I then divided this graph in the day and night parts, but it seems there is no remarkable difference in price.


.